-
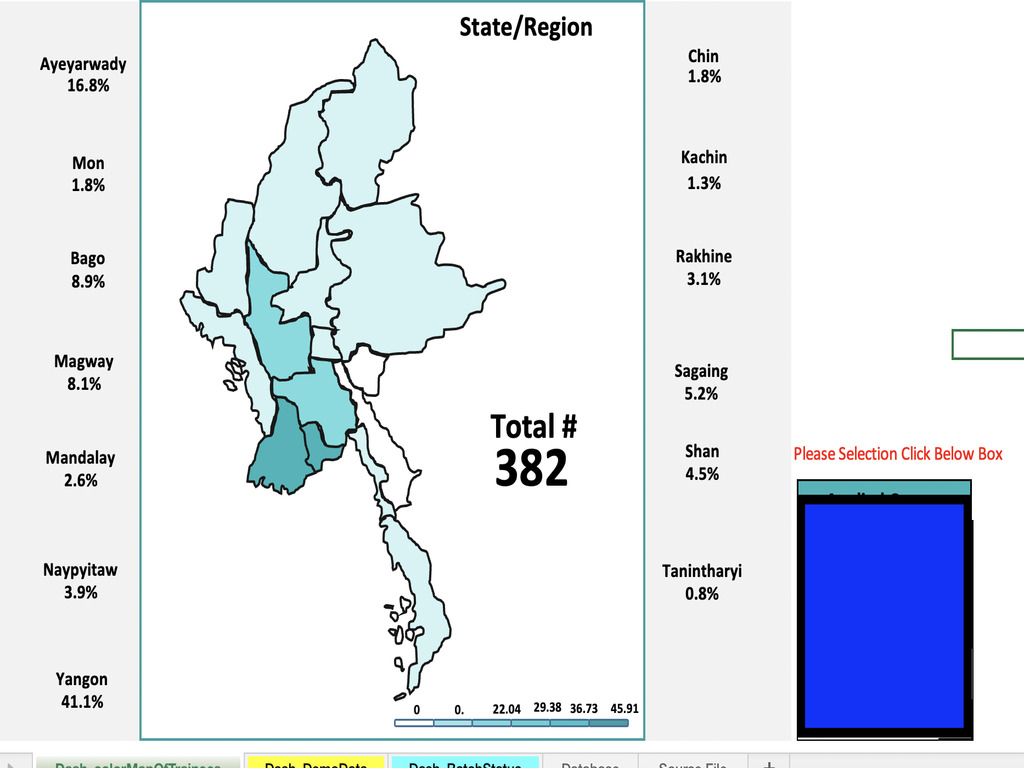
Creation the data visualization with excel interactive map dashboard report on live and limit data.
-
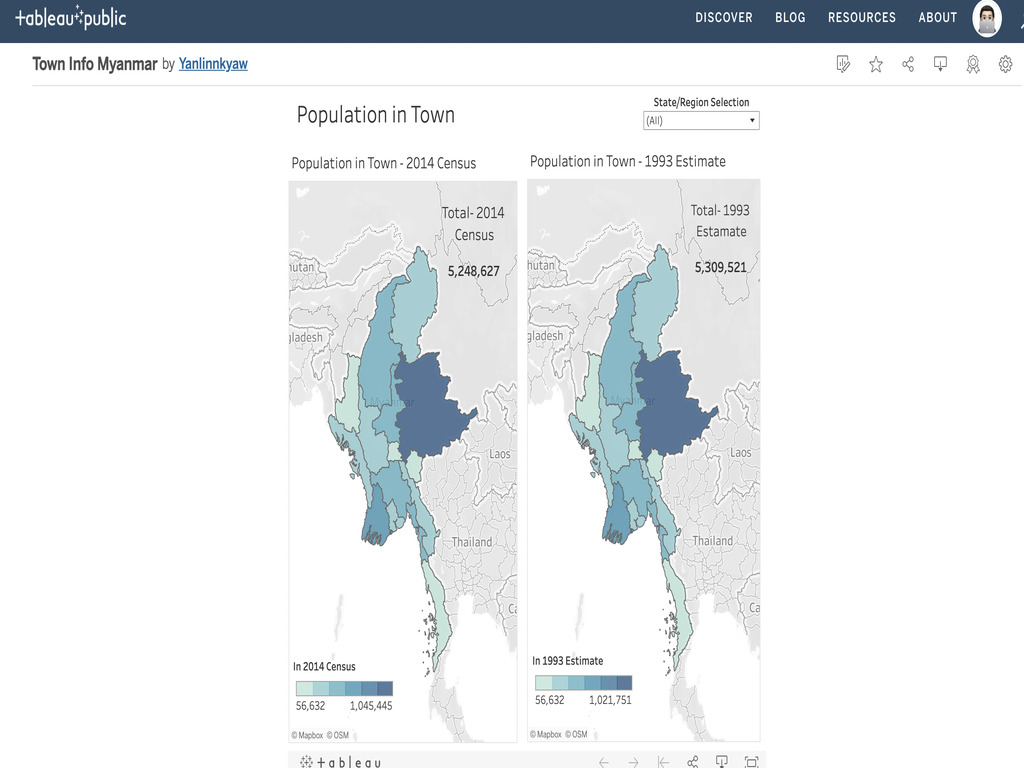
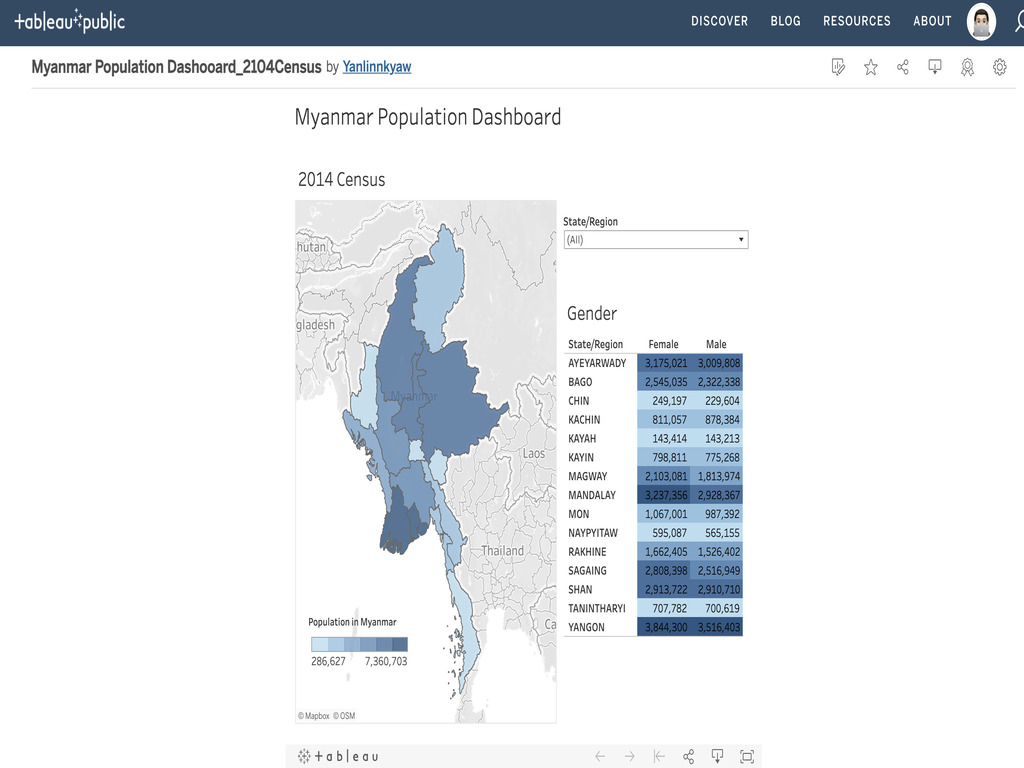
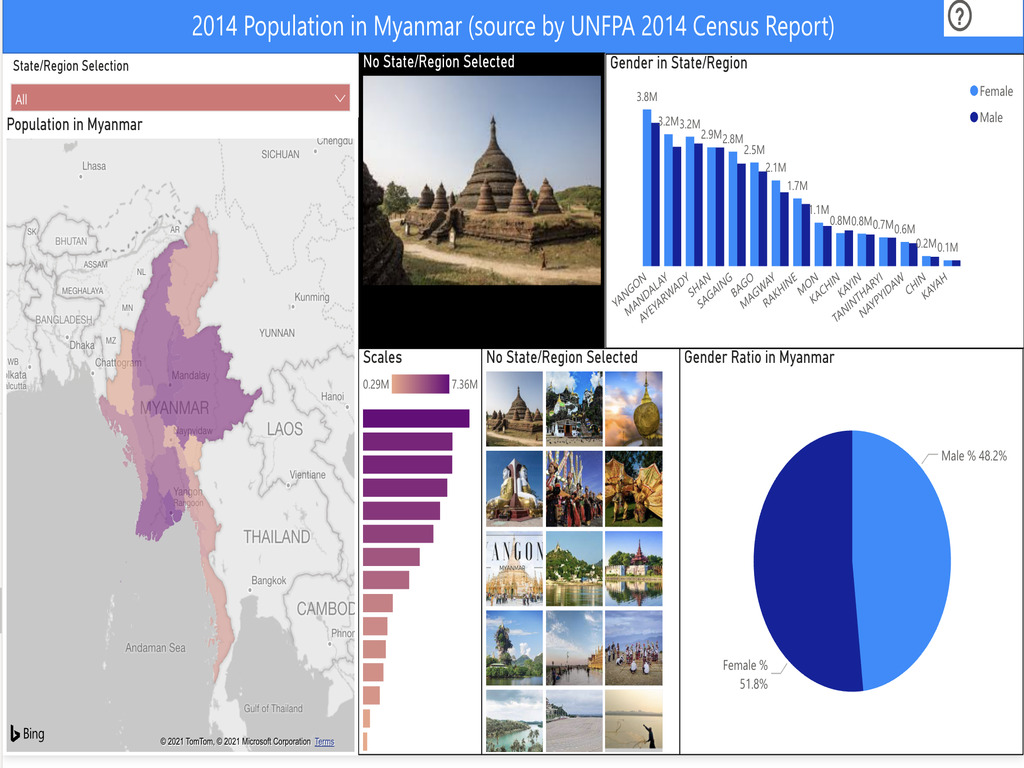
Creation and assistant the data visualization with Tableau and PoweBi softwares.
-
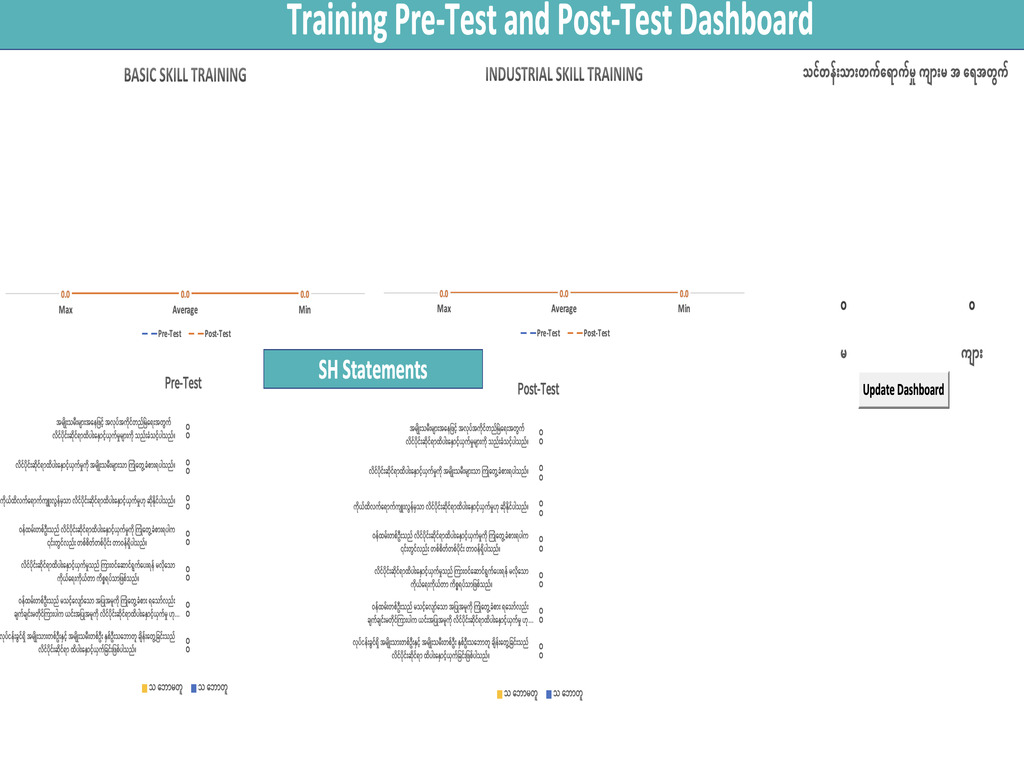
Creation the database and analysis dashboard with excel for training Pre-Test and Post-Test.
-
Creation the analysis graphs, charts and figures as infographic styles.
Project စတင်ရန် လိုအပ်သည်များ
-
To need latest or 2016 above excel version.
-
To need license of PowerBi and Tableau for public sharing. (Optional)
Overall Reviews
What clients say about this service
No reviews yet
Be the first to review this service
Data Visualization


About
I'm Yan Linn Kyaw from Myanmar. I'm a bachelor's degree from Dagon University. I worked in International Non-Profits Organization as an Officer in the Monitoring and Evaluation Sector for more than five years.
https://welldone.short.gy/XbTzi1


